
What Are Dashboard Views on Instagram? Why They Don't Add Up
- Compare dashboard and post views using the same date range and content format; different scopes can explain a mismatch.
- That is why it never equals the sum of your posts: it pools formats, counts boosted delivery, includes old posts still getting views, and uses a window instead of each post's lifetime.
- Views is not people. The unique-account figure is Viewers, which Instagram itself labels "estimated and in-development".
- If a number uses an unfamiliar abbreviation, check your app's number format before interpreting it; see the linked T explainer.
To understand your Instagram professional dashboard views, first match the date range and content type with the individual posts you are comparing. An account summary and an individual post's counter need not use the same scope. The checks below explain common mismatches before you assume there is a reporting problem or quote the wrong figure to a brand.
We read the six Help Center articles that define these metrics (all re-read on September 26, 2026) and lined them up against Meta's developer changelog. Here is what the dashboard number counts, why it will not reconcile with your posts, and which figure to quote.
What does "views" on the Instagram professional dashboard mean?
Instagram defines views as "The number of times your content was played or displayed. Content includes reels, posts, stories, live videos and ads" (About Instagram insights, Instagram Help Center). The dashboard itself is described as giving you "a summary of your performance over the last 30 days", with more detail a tap away (About Instagram dashboards).
Put those two sentences together and you have the full answer to "what are dashboard views": every play or display of anything your account put on screen, across every format, inside a rolling window. Four consequences follow, and each one explains a mismatch people search for:
- Repeats count. When Instagram made views its headline metric it said "Repeat views of content will be counted, similar to how plays and replays are counted for reels" (Social Media Today, August 7, 2024). One person watching a Reel three times is three views.
- Ads are in it. The definition names ads. If you boosted a post, paid delivery lands in the same total as organic views.
- Stories are in it. A Story view is "The number of times your story was played or displayed" (View insights on your Instagram Stories). Daily Stories can make up a large part of the total without showing up anywhere on your grid.
- Old posts keep contributing. As we read the definition, the window is time-based, not post-based. A Reel from last month that is still being recommended adds to this month's figure, which is why the dashboard can rise in a week you did not publish.
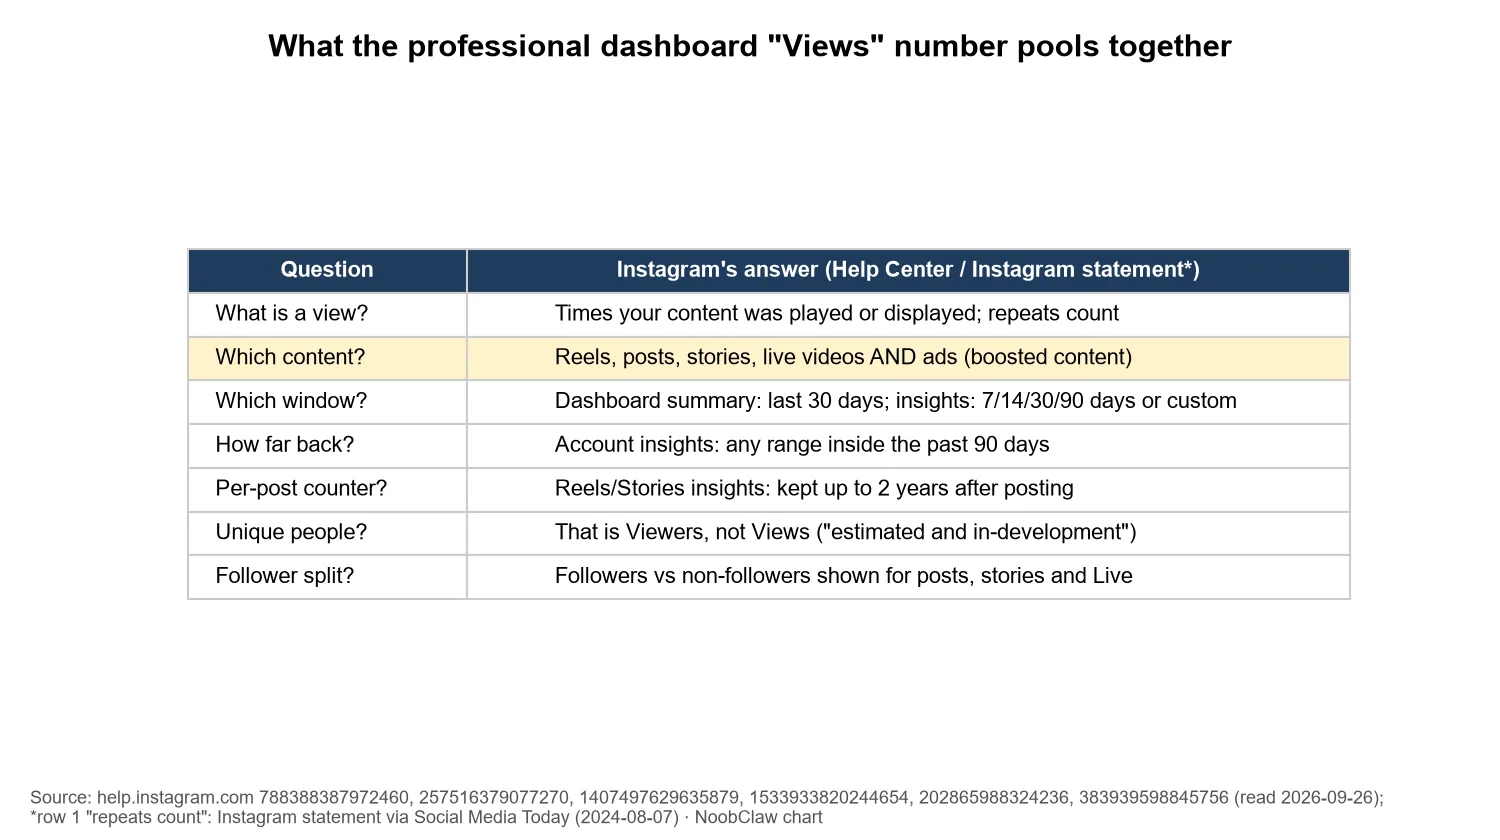
The dashboard answers "how often was anything from this account on someone's screen lately." A post's counter answers "how did this one piece do." Only the second tells you what to make next.
Why don't my dashboard views match the views on my posts?
Because the two numbers have different scopes, different windows and different ingredients. Line them up:
| Dashboard views | A post's view count | |
|---|---|---|
| Scope | Whole account, all formats | One Reel, post or Story |
| Window | Last 30 days on the summary; 7, 14, 30 or 90 days or custom in insights | That post's life so far |
| Paid delivery | Included (ads are named) | Shown per post; boosted posts also get separate ad insights |
| Stories | Included | Only on that Story's own insights |
| How far back | Any range inside the past 90 days | Reels and Stories insights kept up to two years |
The window rules come from Instagram's date-range article: "you can view your account Insights for any time period within the past 90 days", using presets or a custom range whose start and end "must be at least 1 day apart" (Select a date range for your account insights). The web version offers "the last 7, 14, 30 or 90 days" (View account and content insights on Instagram). Reel insights, by contrast, "are available to view for up to two years after the reel's original publish date" (View insights on your Instagram reels).
So a Reel posted 60 days ago with 40,000 lifetime views contributes only the views it earned inside your current 30-day window. Meanwhile your Stories, a boosted post and a few old Reels feed the same total. Adding up your grid and comparing is comparing two differently shaped things; a mismatch is the expected result, not a bug.
One more trap sits next to views: Viewers. That is "the number of unique accounts that have seen your reel on screen at least once", and Instagram adds that it "is different from views, which may include multiple views of your reel by the same accounts" and that the metric "is estimated and in-development" (same Reels article). If a brand asks about unique audience, Viewers (or Reach, where shown) is the closer answer, and you should say it is an estimate.
Why pre-2025 advice about reach, impressions and plays no longer fits
Plenty of older guides to Instagram insights still describe screens built around impressions and plays. Those were retired in two steps. In August 2024 Instagram said it was "introducing 'Views' as the primary metric across all formats including reels, live, photos, carousels, and stories" (Social Media Today, above). Then Meta's Graph API v22.0, released January 21, 2025, introduced a "views" metric and deprecated "impressions" and "plays", with the note that the change "Will apply to all versions April 21, 2025" (Graph API v22.0 changelog, Meta for Developers).
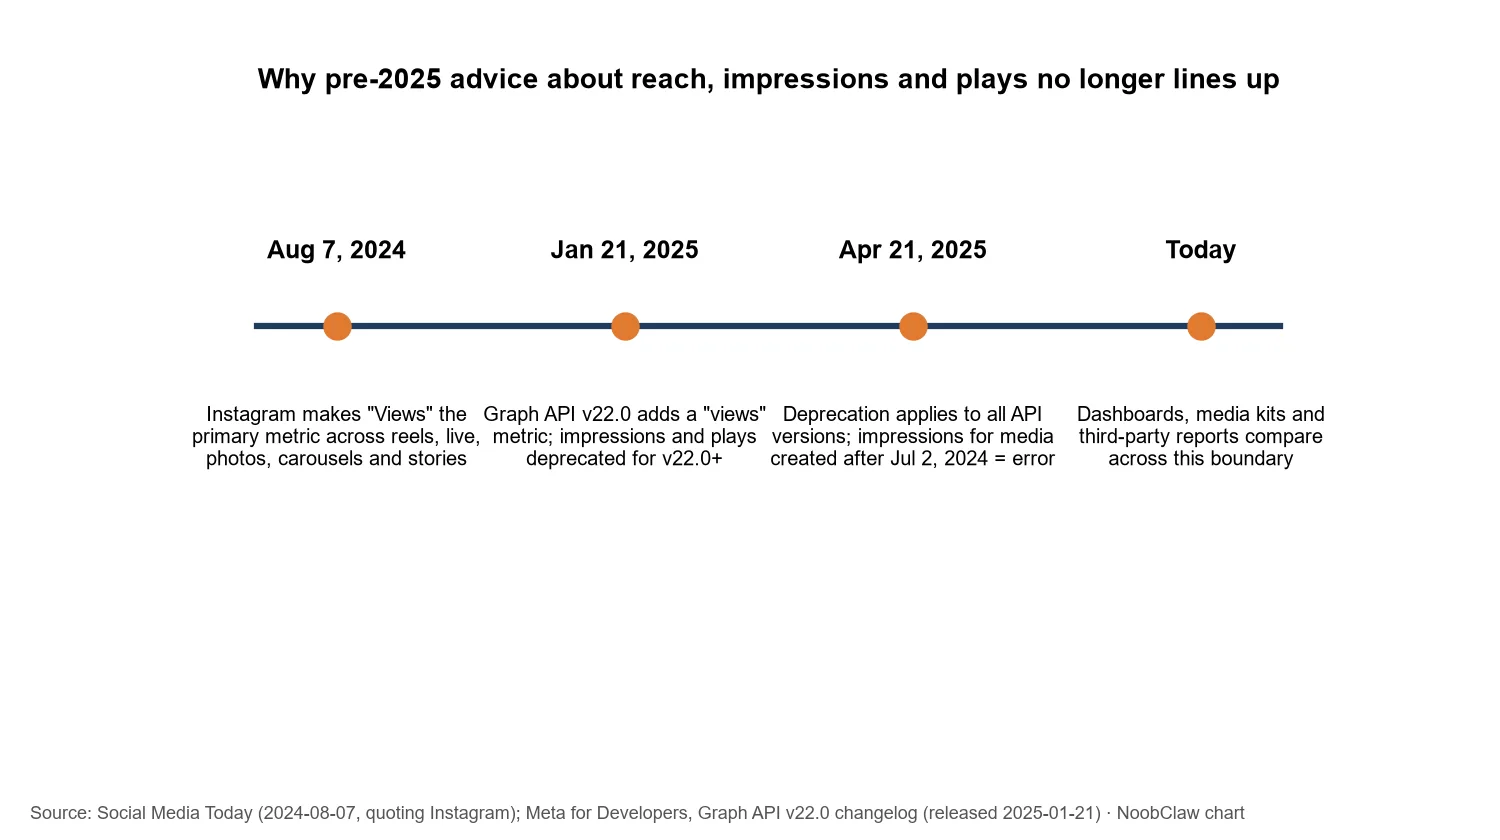
A concrete case of what that did to reporting: the social-analytics vendor Emplifi told customers that after April 21, 2025, data from views would be mapped into its impressions and video views fields, and that some rolling-window impression charts would be removed without replacement (Emplifi documentation). In other words, a column still labelled "impressions" in a third-party report can contain views after that date. If your year-over-year chart crosses April 2025, part of the jump or drop is a change of definition, not a change in your audience. Rebase the baseline instead of comparing across the boundary.
Which number should you give a brand?
Label the metric, account, date range and content format in your report. Compare like with like; if two figures use different scopes, show them separately rather than forcing a reconciliation.
Not the dashboard total. It is the biggest number you have, which is exactly why it invites a correction later: it mixes formats, includes paid delivery and counts repeats, while a brand is pricing what one piece of sponsored content will do.
The version that survives scrutiny: median views per Reel over the last 30 days, stated with the format, the window and the number of posts, plus Viewers or Reach for audience size (labelled as an estimate). Our judgement is that median beats average here because one breakout Reel can drag an average far above what a typical post does; a brand buying one post cares about the typical one.
If you report across several accounts, the same rule applies per account: same format, same window, same post count, or the comparison means nothing. Tools that manage many accounts, NoobClaw included, keep each account in its own logged-in browser session, which saves logging in and out when you check each account's insights by hand. They do not change the arithmetic: a matrix of 30-day totals is still a matrix of apples and oranges.
What does the "T" next to dashboard views mean?
If your dashboard shows something like "1.2T views", the T is not trillion and it is not a new metric. It is a thousands abbreviation from a regional number format: the Unicode locale data that phones use wrote thousands as T for English (India) for several releases before switching back to K. So 1.2T means roughly 1,200 views. Meta's metric pages define views and never mention a T metric. The evidence, the phone settings involved and a 30-second way to confirm it on your own screen are in what T means in Instagram views.
So what is the dashboard for? Used as a trend line rather than an accounting system, it is useful in three ways:
- Direction over weeks. Is the 30-day total rising or falling across several readings? The slope matters more than the level.
- Divergence. Flat views while you doubled your posting rate is a signal worth chasing; so is a sudden drop that no content change explains. Start with why Reels views drop suddenly.
- Followers versus non-followers. Instagram shows this split "For posts, stories and Instagram Live" (About Instagram insights). It separates "my existing audience is watching" from "new people are finding me", which need different fixes; see why Instagram stops reaching non-followers, and if non-follower views have gone to near zero, check recommendation eligibility.
Two limits to know: audience demographics need you to "reach or engage over 100 accounts" on a preset timeframe, and if you switch the account to private "you'll lose access to insights", regaining past data only if you go public again within 90 days (both from the insights articles above).
FAQ
Why don't my dashboard views match my post views?
The dashboard counts every play or display of all your content (Reels, posts, Stories, Live and ads) inside a time window, repeats included. A post shows that one post's lifetime count. Different scope, window and ingredients, so they are not designed to reconcile.
Do dashboard views count the same person more than once?
Yes. Instagram counts repeat views. For unique accounts look at Viewers or Reach, and treat Viewers as an estimate: Instagram labels it "estimated and in-development".
How far back can I see dashboard views?
Account insights cover any range within the past 90 days, with 7, 14, 30 and 90-day presets or a custom range. Individual Reels and Stories keep their insights for up to two years after posting.
What to do today: stop reconciling the dashboard against your grid. Pick one format and one 30-day window, track median views per post, and use the dashboard only to see which way the account is moving.
Sources
- About Instagram insights — Instagram Help Center — undated, read 2026-09-26 — https://help.instagram.com/788388387972460
- About Instagram dashboards — Instagram Help Center — undated, read 2026-09-26 — https://help.instagram.com/257516379077270
- Select a date range for your account insights on Instagram — Instagram Help Center — undated, read 2026-09-26 — https://help.instagram.com/1407497629635879
- View account and content insights on Instagram — Instagram Help Center — undated, read 2026-09-26 — https://help.instagram.com/1533933820244654
- View insights on your Instagram reels — Instagram Help Center — undated, read 2026-09-26 — https://help.instagram.com/202865988324236/
- View insights on your Instagram Stories — Instagram Help Center — undated, read 2026-09-26 — https://help.instagram.com/383939598845756/
- Instagram Updates Metrics to Focus Creators on Views — Social Media Today — 2024-08-07 — https://www.socialmediatoday.com/news/instagram-updates-metrics-to-focus-creators-on-views/723645/
- Graph API v22.0 changelog — Meta for Developers — 2025-01-21 — https://developers.facebook.com/docs/graph-api/changelog/version22.0/
- Instagram Insights Metrics Deprecation (April 21, 2025) — Emplifi Documentation Center — 2025 — https://docs.emplifi.io/platform/latest/home/instagram-insights-metrics-deprecation-april-2025